

Reports
Updated November 14, 2026
See revenue, how deals move through your stages, and where wins come from.
How it works
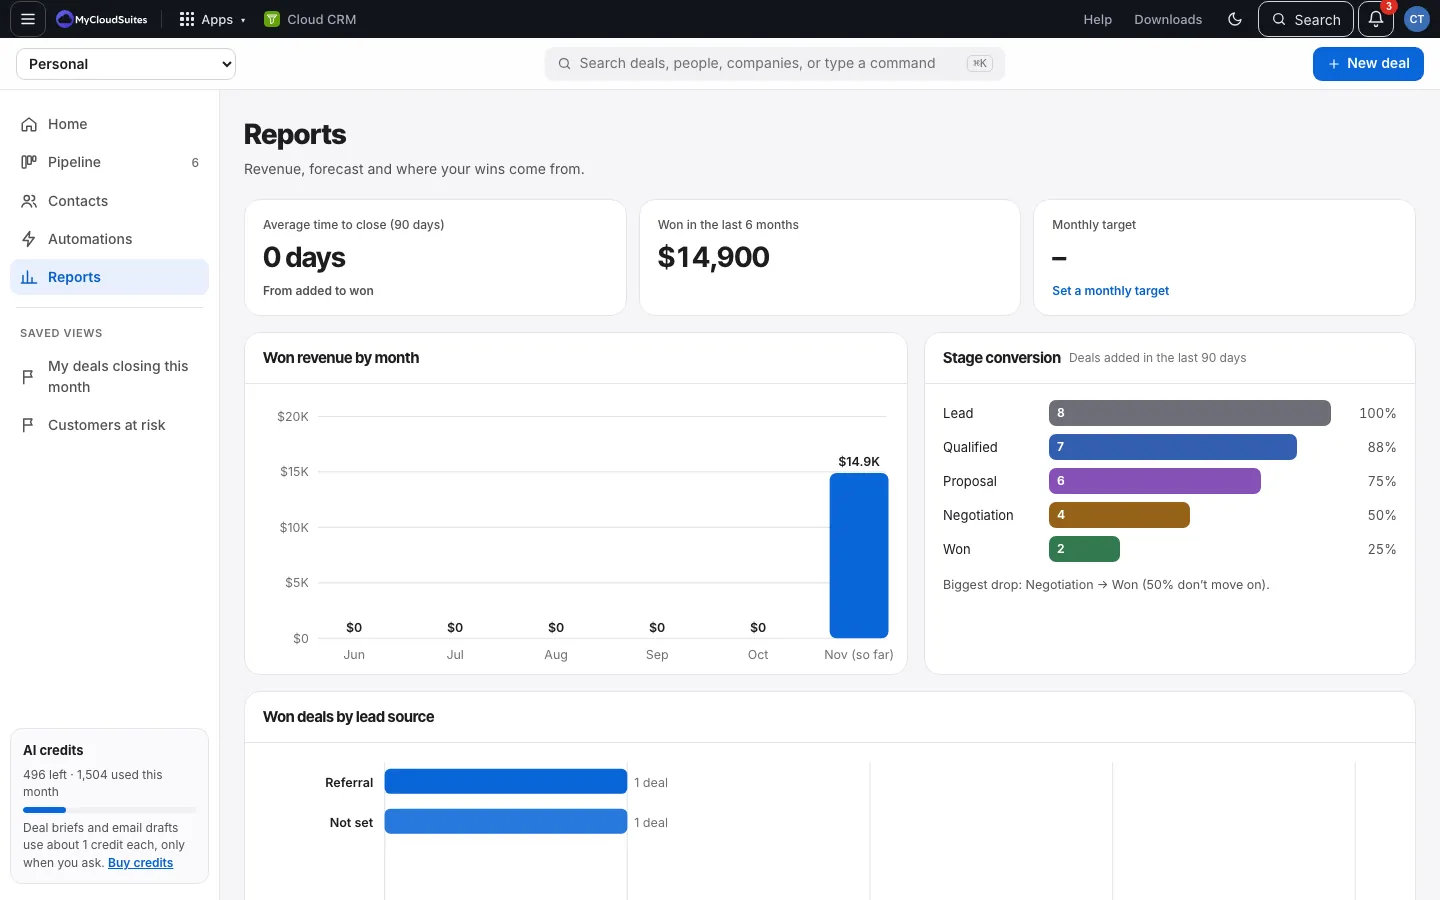
- Average time to close (90 days): from when a deal was added to when it was won.
- Won in the last 6 months.
- Monthly target: yours, or Set a monthly target.
- Goals this month: what each person has won against their monthly goal, and the team’s. Owners and admins choose Set goals. See Monthly goals.
- Forecast by close month: open deals by the month they’re due to close. The solid part is the weighted value (each deal × its stage’s chance), the lighter part the rest. Deals whose close date has passed, or with none, are counted underneath.
- Why deals were lost: the reasons picked when deals were marked Lost in the last 90 days. See Lost reasons.
- Won revenue by month: a chart of the last months’ wins, with your target line.
- Stage conversion: of the deals added in the last 90 days, how many reached each stage, and the biggest drop between two stages.
- Won deals by lead source: which sources bring your wins. Set a Lead source on deals to fill this in.
Good to know
- Reports use every deal, including closed ones older than the table shows.
- Money adds up in your main currency. See Currencies.