

Add and edit a chart
Updated November 13, 2026
Charts in Cloud Slides keep their numbers inside the presentation, so you can change them any time.
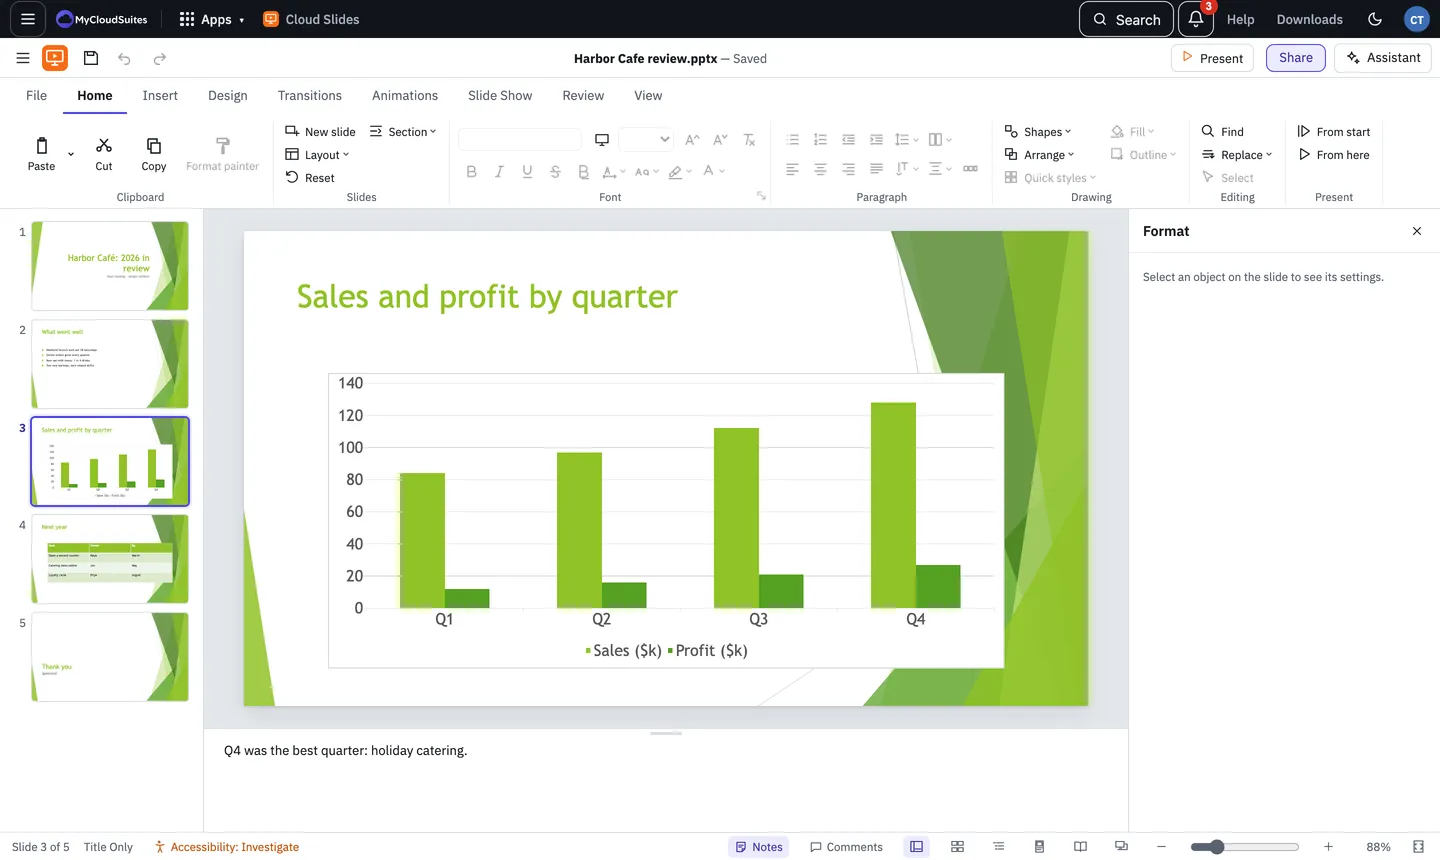
Insert a chart
- Choose Insert › Chart.
- Pick a kind: Column, Bar, Line, Pie, Doughnut, Area, Scatter or Combo, or one from the families below them (3-D, Stock, Surface, Radar, Bubble, Hierarchy, Statistic, Waterfall and Funnel).
- A table of sample numbers opens under the slide. Type your own; the chart changes as you go.
Change the numbers later
Select the chart and choose Chart Design › Edit data. You can add rows and series, and paste numbers in.
Change how it looks
On the Chart Design tab:
- Add element turns on or off the axes, titles, data labels, data table, error bars, gridlines, legend, trendline and up/down bars.
- Quick layout picks a ready-made arrangement.
- Change colours and Styles change its colours and look.
- Switch row/column swaps what’s on the axis and what’s in the legend.
- Change chart type turns it into another kind and keeps your numbers.
Format one part
- Click the part, such as a bar, the legend or an axis. Or pick it from the list on the Format tab.
- Choose Format selection. The Format pane shows its fill, line, effects and options, such as an axis’s bounds or the gap between bars.
- Reset style puts that part back to the chart’s style.
Not available yet
Select data, Refresh data and Add element › Lines are off for now.
Need more? Charts and Cloud Sheets, or contact us.